1 Day 1 (January 20)
1.1 Welcome
-
- Recommended book
- Recomended software
- Office hours
- Zoom office hours
- Reproducibility requirement (data analysis can be successfully repeated by someone other than you)
- Academic Honesty: working in groups, sharing code, use of AI, etc.
1.2 Course pre-assessment
- Download here
- Due Friday January 23th
1.3 Course format
Previous course reflections and changes
My philosophy and what I can offer
- Is the course right for you?
- How to learn statistics?
- How to spend your time?
- A prediction about the future
Course design
- Phase 1-Crash course in spatio-temporal statistics
- Standard lectures with a good amount of reading
- Finish before spring break
- Phase 2-Problem based learning
- Phase 2 is designed to mimic research
- Data/question motivated applications
- If you have a data set or problem you would like me to consider using in class please send me an email with a short description
- Phase 3-Class project of your choice
- Phase 1-Crash course in spatio-temporal statistics
Grades?!
- Bi-weekly journal (40%)
- Activities (10%)
- Final project (50%)
- What about traditional homework assignments and exams?
- Activities vs assignments?
How to best interact with me
- Depends on your career path
- Easy to access online once we are established
- Please make good use of our time (e.g., zoom vs. in-person)
How to best interact with students in this class
- Huge diversity of majors and professions
- Huge diversity of skills
- A comment about your KSU degree and amount of statistics
- Who is in this class?
url <- "https://www.dropbox.com/scl/fi/79f3hgz4wwvyufgc5vnor/students_STAT_764.csv?rlkey=vqwnt0krz7d7xz44acowg5bop&dl=1"
df <- read.csv(url)

par(mar=c(13,2,2,2))
plot(rev(sort(table(df$degreeProgram))),las=2,xlab="",ylab="Number of students",ylim=c(0,5))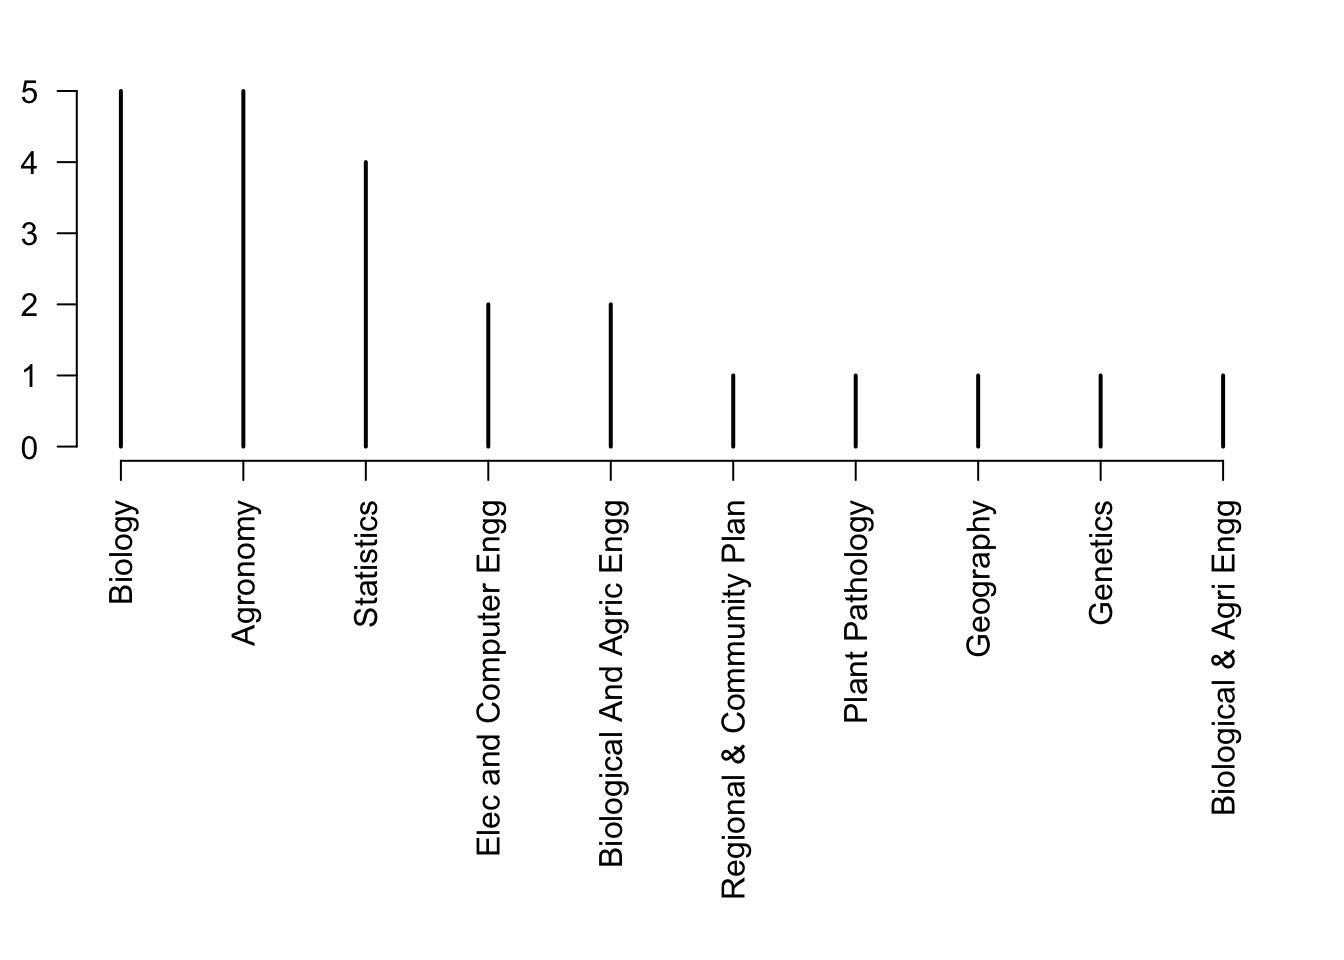
par(mar=c(13,2,2,2))
plot(rev(sort(table(df$classLevel))),las=2,xlab="",ylab="Number of students",ylim=c(0,13))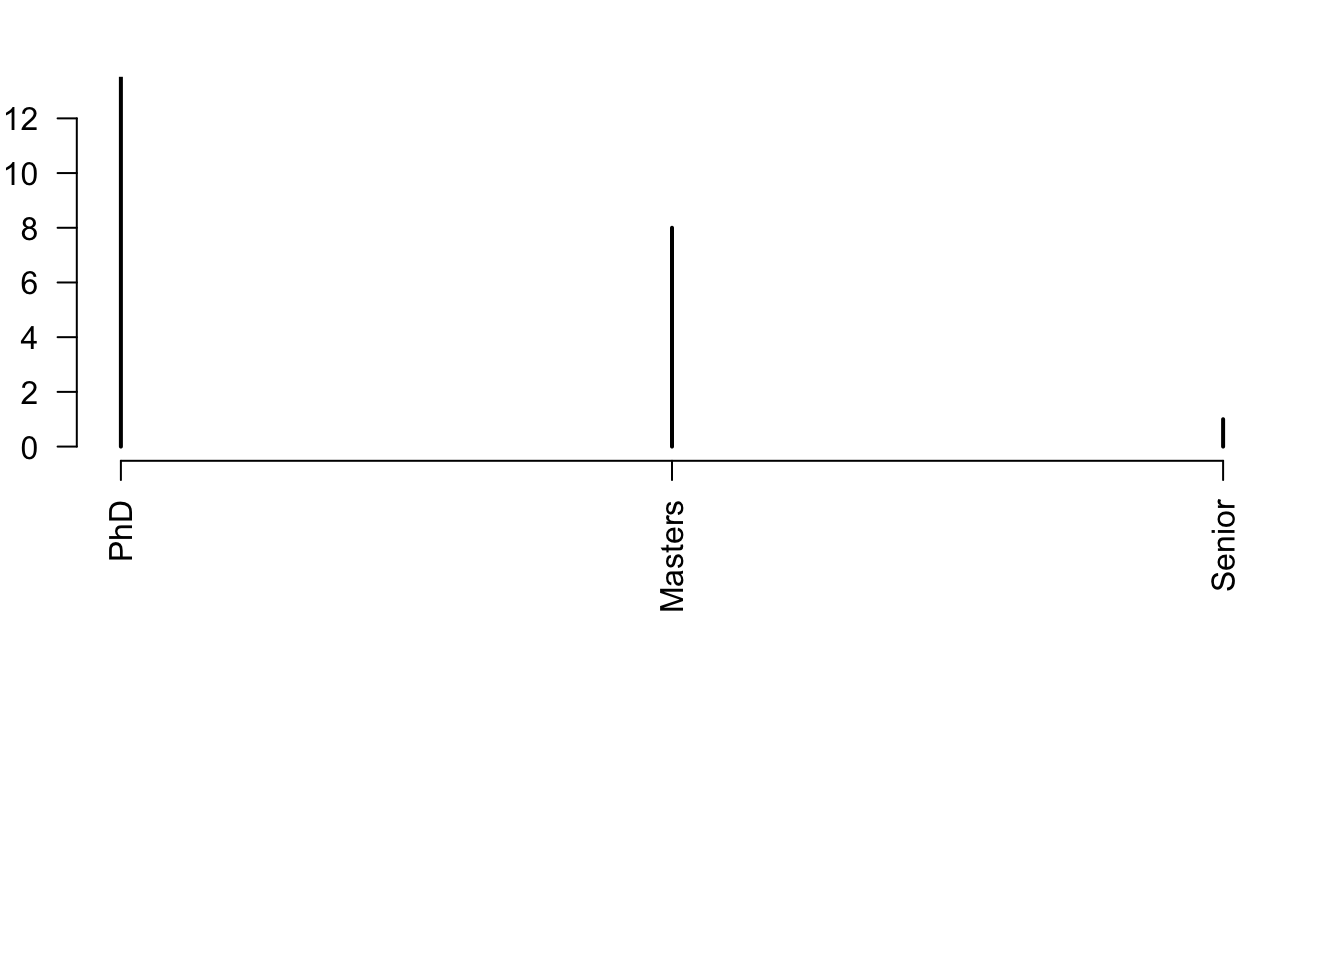
1.4 Reading
- Read pgs. 1-15 in Wikle et al. (2019)
1.5 Opening example: Human movement
- The goal of this activity is to show you how cool spatio-temporal statistics is!
- Human movement modeling with the linear regression model and other fancy tools!
- Trajectories are a time series of the spatial location of an object (or animal).
- We can usually pick the object and the time that we obtain its spatial location (i.e., time is fixed)
- The location is a random variable in most cases, but time can also be a random variable.
- In-class marathon example (Download R script here)